Predicting who will win the annual dance that is the NCAA basketball tournament is one I do annually and usually fail miserably. That is because most of my predictions are based on hunches, seedings and want of a Cinderella story. I'm a casual fan who enjoys the sport, but not enthralled in such a way that I get more than an average score on ESPN's tournament challenge.
This year, I'm going to look at it purely by the numbers. Where this might seem to be a fairly obvious thing to do, I think it may throw up some surprises and I'm keen to say how it compares to my normal 'hunch' backing.
The stats
Choosing which stats to use in a sport that is full of them is potentially a minefield and I could got bogged down in hundreds of tiny nuances that often decide winners and losers. Instead I'm going to use 4 main stats that are key to winning games outlined in Dean Oliver's book, 'Basketball on Paper'.
Using the stats and forumula outlined in this article https://www.basketball-reference.com/about/factors.html these roughly require:
- Field Goals attempted and made
- Turnovers
- Free throw attempts and made
- Offensive and Defensive rebounds
Both offensive and defensively for each stat.
The method
Grabbing these stats from NCAA official stats pages is fairly straightforward for the offesnive stats. However getting the free throw attempts faced is not available so I've roughly approximated this as number of fouls.
Rebounds is also hard to get defensively i.e. the number of D-rebounds and O-rebounds a particular team has faced is not available.
When determining a match up, the following formula is used given two teams playing each other (A and B). The score for team A is defined as:
adjusted_fg = (shooting_score(A) + shooting_score_defense(B)) / 2
Shooting score is defined as in the article mentioned above
adjusted_turnovers = (turnover_score(A) + turnover_score(B)) / 2
Turnover score is defined in the article above
rebounds = O rebounds (A) / (O rebounds(A) + D rebounds(B))
adjusted_free_throws = (ft_score(A) + ft_score_defense(B)) / 2
Where ft_Score is defined in the article, but when calculating defensive FTs to use fouls committed x 0.69 (average number of FTs made in NCAA)
Then weighting thus:
(adjusted_fg * 40) + (adjusted_turnovers * 25) + (rebounds * 20) + ( adjusted_free_throws * 15)
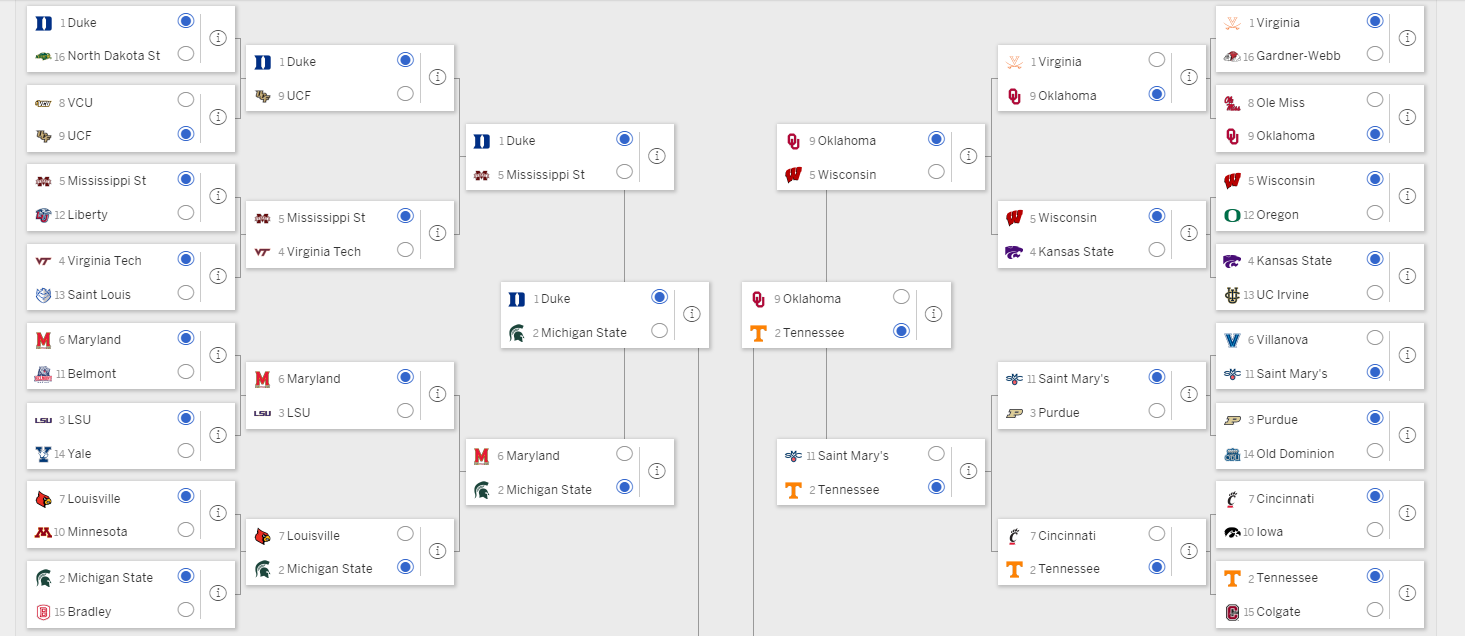
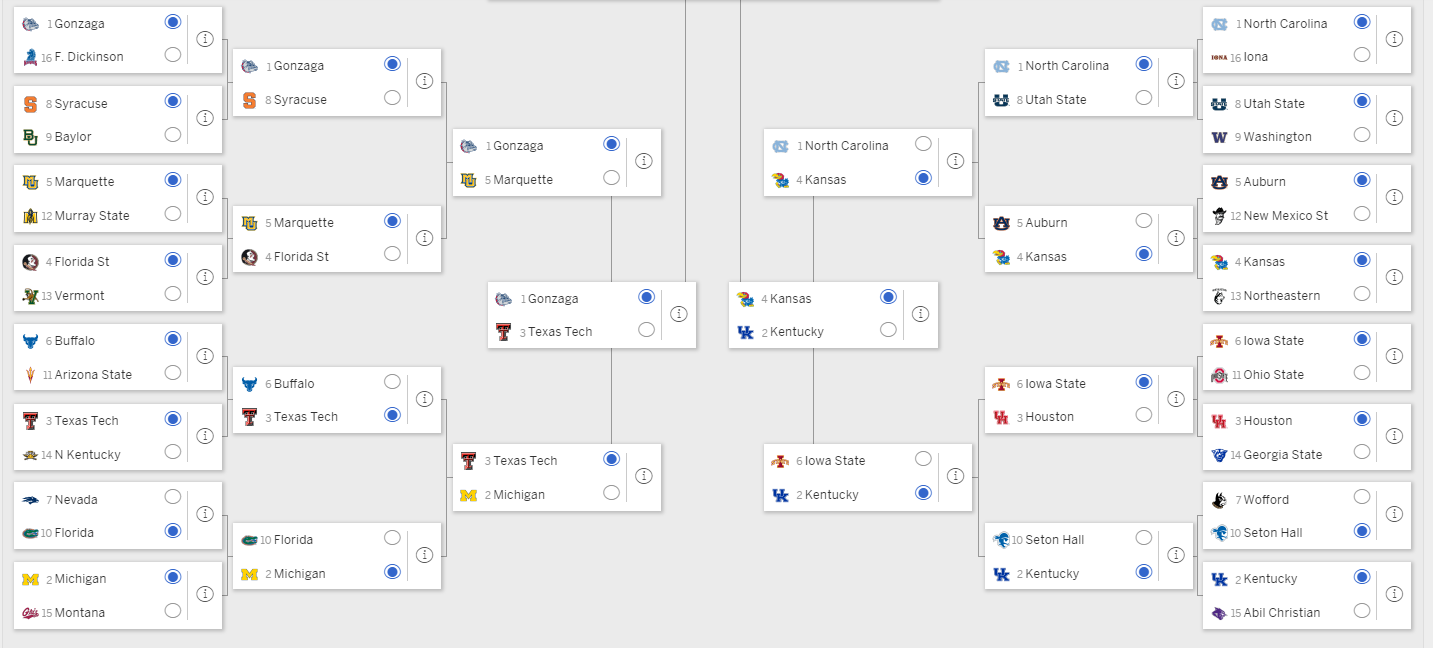
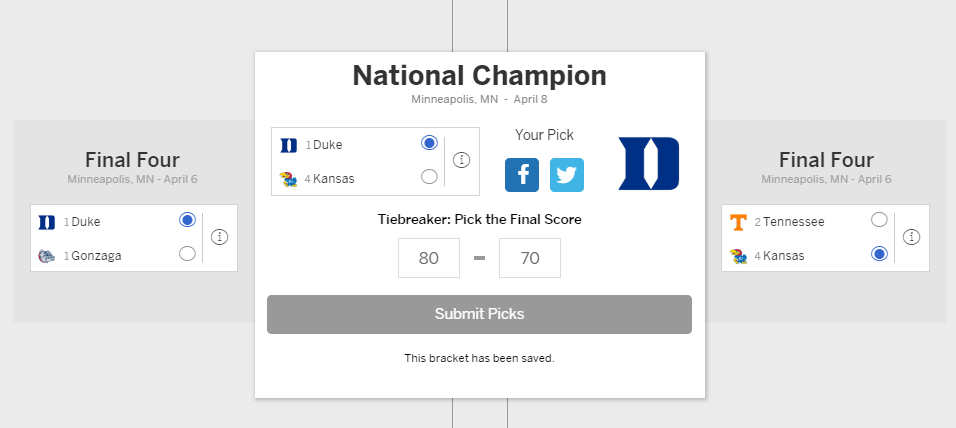
The result
The first pass was interesting and had Michigan State winning the whole thing but had UC Irvine making the final 4. It also had Michigan(2) and Virginia(1) leaving in the first round, so I had a play with the weightings a little bit. Nothing helped, so I added in a weighting for strength of schedule. This made a tonne of sense because the college system means that teams can get really good stats without playing a decent team. The new formula is now:
((adjusted_fg * 40) + (adjusted_turnovers * 25) + (rebounds * 20) + ( adjusted_free_throws * 15)) x (sos)
This seems much better, so the final prediction is Duke (unsurprisingly):